The platform the client bought after watching it work.
We built it to run our own crews on a €200m fibre programme. The operator saw it working on their own construction, and asked whether it could run everyone’s.
Two months from kick-off to live.

We built it to run our own crews on a €200m fibre programme. The operator saw it working on their own construction, and asked whether it could run everyone’s.
Two months from kick-off to live.
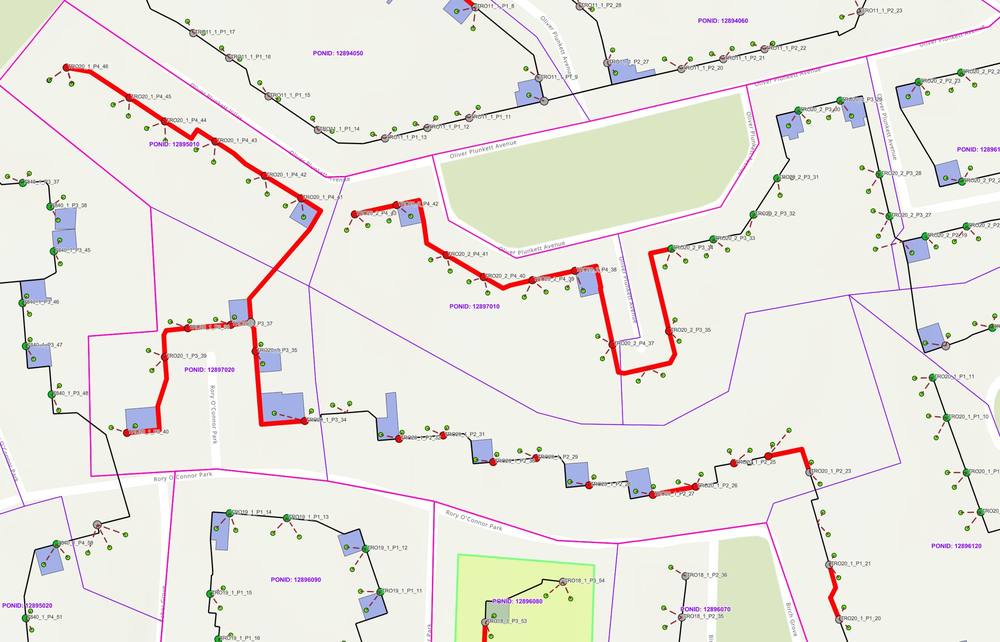
BYNTGroup did not pitch this platform. While delivering construction on a national full-fibre programme, we built an internal GIS system to manage our own crews, our own progress and our own as-built records — because a build at that scale cannot be run on spreadsheets.
The operator saw it working on live construction. Not in a demo, not in a proposal, but on their own programme, producing their own data faster and cleaner than anything else on the job. They contracted BYNTGroup to build the same capability for every build partner on the programme — including our competitors.
An operator running a national build through multiple contractors has a reporting problem long before it has a construction problem. Each build partner works in its own system, to its own data model, on its own reporting cycle.
Nobody can answer the question that actually matters — how many premises are genuinely ready for sale this week — without days of spreadsheet reconciliation, and by the time the answer exists it is out of date.
Five build partners migrated into a single ArcGIS Online platform, integrated with the operator’s own ArcGIS Enterprise environment.
Three parts. The migration — reconciling five incompatible schemas into one model without losing partner-specific detail, and bringing every partner’s site photography across with it. Then synchronisation — automated pipelines keeping the platform current against each partner’s external system, so data flows continuously rather than being re-imported. Then the layer everyone sees: operational dashboards giving the operator, and each partner, live visibility of build status against plan.
Because it was configured, not developed. The platform runs on ArcGIS rather than on bespoke software, which means there is no platform build programme in front of it.
BYNTGroup does not sell or upsell Esri licences. The platform runs on the client’s existing licences, or we help the client choose the right mix.
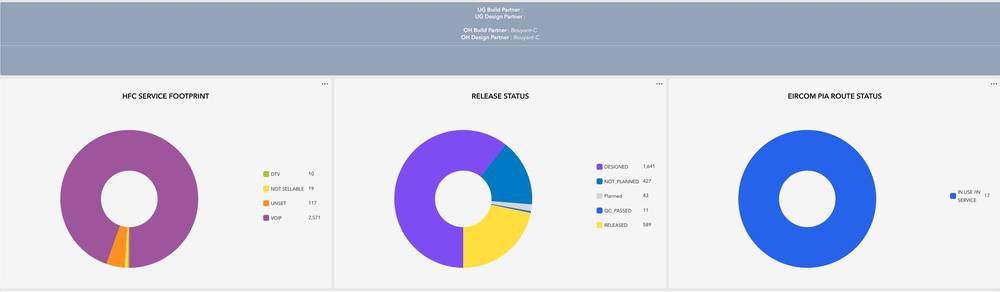
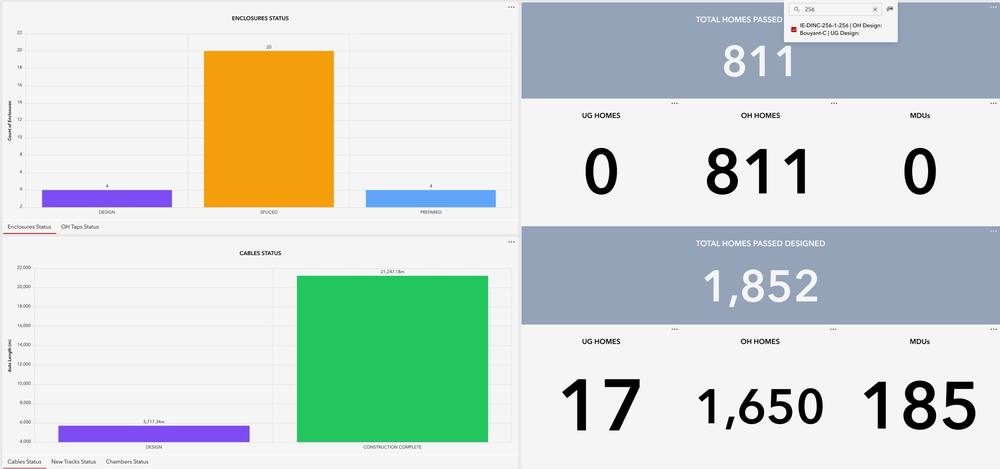
Reporting moved from a reconciliation exercise to real time, or inside 24 hours from every build partner. The operator gets daily visibility of homes released for sale, and homes pending release after quality acceptance.
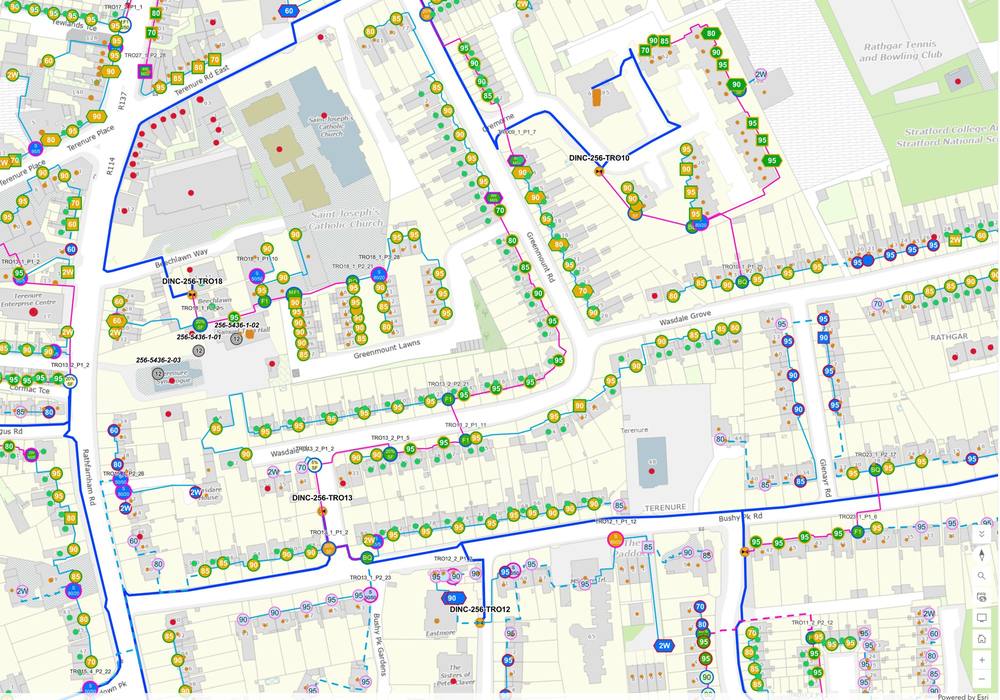
One view of the network instead of five fragmented systems — and every partner’s photographic evidence in the same place as the data it belongs to.
Tell us about the programme and we will come back with a practical delivery plan.
Start a conversation